
Frontend Observability
PrometheusEmpower your decisions with real user monitoring insights
Gain precise, end-to-end user insight. Empower your team, optimise products, and stay ahead of the competition.
Start observing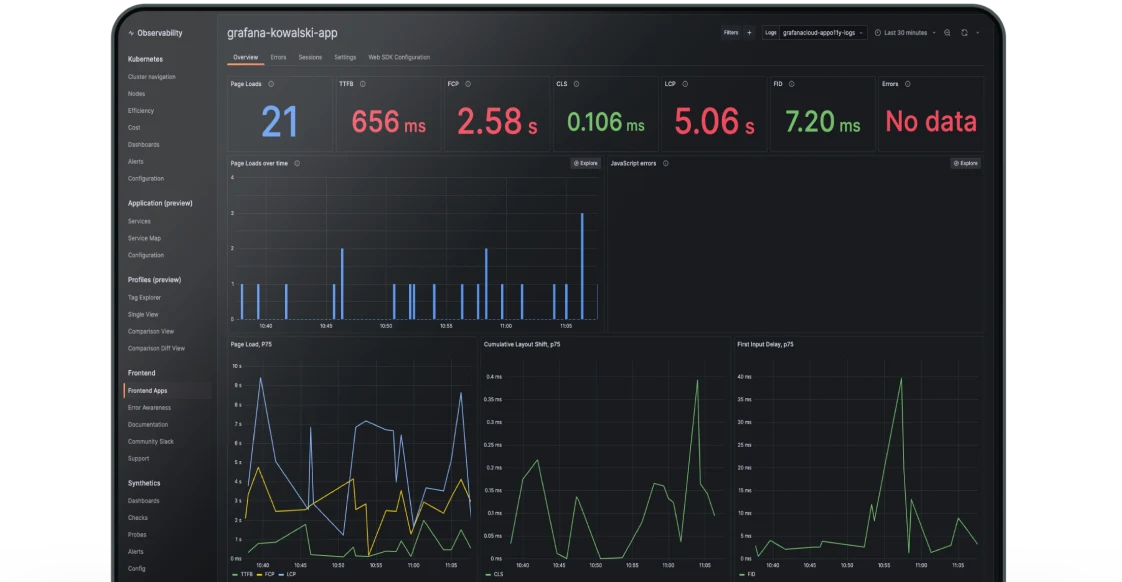
Experience the power of our solutions
and see what they can achieve for you.
 Monitor end user experience
Track and report essential web vitals metrics to understand and improve user experience.
 Track errors with complete stack traces
Automatically group similar errors, assess their importance, and pinpoint the specific lines of code causing each error.
 See the whole user journey, from start to finish.
Link frontend sessions with request traces for a complete view of the entire stack.

How to get started
- 1Register your applicationSet your app’s name and the domains that send data.
- 2Integrate the Faro Web SDKOne package and a few lines in your entry file.
- 3End-to-end user insightConnect frontend sessions to request traces for the full picture.
Logs and traces for Frontend Observability are stored in your Grafana Cloud stack, at regular Grafana Cloud pricing. Grafana Cloud pricing · Blog post
Having trouble? Get Help
Setup App
A unique name to identify and differentiate this frontend observability application from your others.
Allowed CORS origins for app access. See docs for details.
*.acme-monitoring.com
Advanced CORS settings
Allow credentials, exposed headers and max age, if your app needs them.
Configure Your Application
Connect Your Application
Choose how you want to connect your frontend application
Import Existing Configuration
Already have a configuration file? Upload it here.
Configure Your Application
Select your application framework
Installation method:
Setup Complete!
- App Name:
- acme-monitoring
- Application Framework:
- React
- Allowed Domains:
- *.acme-monitoring.com
- Endpoint URL:
- https://faro-collector-prod-eu-west-2.grafana.net/collect
Next steps
Applications
+ New application Frontend Observability
acme-monitoring
You are reaching your free tier session limit with 41,280 out of 50,000 sessions used. When the limit is reached, new data is dropped. Upgrade your account to prevent data loss and keep using Frontend Observability. See plans
- 10
- 8
- 6
- 4
- 2
- 0
- 13:25
- 13:30
- 13:35
- 13:40
- 13:45
- 13:50
- 13:55
- Page Loads
- Errors
- 10
- 8
- 6
- 4
- 2
- 0
- 13:25
- 13:30
- 13:35
- 13:40
- 13:45
- 13:50
- 13:55
- onLoad Time
Page Performance
Tт| Page ID | TTFB | FCP | LCP | CLS | INP | Load Time |
|---|---|---|---|---|---|---|
| ⊕ | 826ms | 0.21s | 1.9s | 234ms | 2347ms | 18ms |
| ⊕ | 740ms | 0.22s | 2.1s | 200ms | 743ms | 4ms |
| ⊕ | 630ms | 1.02s | 4.6s | 100ms | 200ms | 120ms |
| ⊕ | 530ms | 3s | 1.2s | 0.94ms | 1114ms | 4ms |
| ⊕ | 412ms | 0.98s | 12.7s | 100ms | 123ms | 4ms |
| ⊕ | 90ms | 2s | 6.0s | 800ms | 355ms | 4ms |
| Page ID | Bounce Rate | Avg Session Duration | Conversion Rate |
|---|---|---|---|
| ⊕ | 89% | 2m 41s | 3.4% |
| ⊕ | 75% | 3m 12s | 5.1% |
| ⊕ | 40% | 4m 05s | 8.2% |
| ⊕ | 43% | 1m 58s | 4.7% |
| ⊕ | 45% | 2m 20s | 6.0% |
| ⊕ | 12% | 5m 33s | 11.9% |
| Page ID | JS Errors | Failed Requests | Long Tasks | Page Weight |
|---|---|---|---|---|
| ⊕ | 12 | 3 | 41 | 2.4 MB |
| ⊕ | 4 | 0 | 18 | 1.1 MB |
| ⊕ | 9 | 6 | 33 | 3.8 MB |
| ⊕ | 2 | 1 | 12 | 1.2 MB |
| ⊕ | 7 | 2 | 27 | 3.6 MB |
| ⊕ | 0 | 0 | 6 | 0.9 MB |
Views
Tт| View ID | Errors | Active User | Load Time | |
|---|---|---|---|---|
| / | ⊕ | 2347ms | 826 | 18ms |
| product_detail | ⊕ | 743ms | 740 | 4ms |
| /products/1/detail | ⊕ | 200ms | 630 | 120ms |
| product_detail | ⊕ | 1114ms | 530 | 4ms |
| /products/1/detail | ⊕ | 123ms | 412 | 4ms |
| product_detail | ⊕ | 355ms | 90 | 4ms |
- 25 s
- 20 s
- 15 s
- 10 s
- 5 s
- 0 ms
- 08:15
- 08:20
- 08:25
- 08:30
- 08:35
- 08:40
- TTFB
- FCP
- LCP
- 0.5 ms
- 0.4 ms
- 0.3 ms
- 0.2 ms
- 0.1 ms
- 0 ms
- 08:15
- 08:20
- 08:25
- 08:30
- 08:35
- 08:40
- CLS
- 10 ms
- 8 ms
- 6 ms
- 4 ms
- 2 ms
- 0 ms
- 08:15
- 08:20
- 08:25
- 08:30
- 08:35
- 08:40
- FID
Javascript Errors
| Type | Message | Count | Users Impacted | Action |
|---|---|---|---|---|
| TypeError | 2 | 7 | ||
| Error | 3 | 2 | ||
| SyntaxError | 27 | 26 | ||
| Error | 1 | 4 | ||
| Error | 24 | 19 | ||
| Error | 4 | 5 | ||
| Error | 5 | 8 | ||
| Error | 2 | 5 | ||
| Error | 2 | 6 | ||
| Error | 2 | 11 | ||
| Error | 2 | 20 | ||
| Error | 2 | 23 |
| Name | Type | Size | Size Compressed | Load Time | Blocking |
|---|---|---|---|---|---|
| https://code.google.com/jquery.js | JS | 85.1 KB | 85.1 KB | 18ms | Yes |
| https://code.google.com/jquery.js | JS | 85.1 KB | 85.1 KB | 18ms | Yes |
| https://cdn.bootstrap.com/5/common.css | CSS | 43.1 KB | 43.1 KB | 18ms | No |
| https://cdn.bootstrap.com/5/common.css | CSS | 43.1 KB | 43.1 KB | 4ms | Async |
| https://my-shop.com/product-detail | HTML | 580 KB | 43.1 KB | 4ms | No |
| https://my-shop.com/product-detail | HTML | 580 KB | 580 KB | 4ms | Async |
| https://code.google.com/jquery.js | JS | 580 KB | 580 KB | 120ms | Yes |
| https://code.google.com/jquery.js | JS | 18.2 KB | 580 KB | 120ms | Yes |
| https://code.google.com/jquery.js | JS | 18.2 KB | 18.2 KB | 120ms | Yes |
| https://cdn.bootstrap.com/5/common.css | CSS | 18.2 KB | 18.2 KB | 4ms | Yes |
| https://cdn.bootstrap.com/5/common.css | CSS | 45.5 KB | 18.2 KB | 4ms | Yes |
| https://cdn.bootstrap.com/5/common.css | CSS | 45.5 KB | 18.2 KB | 4ms | Async |
Session Details:
TIMELINE
- 50ms
- 1.0s
- 1.5s
- 2.0s
- 2.5s
- 3.0s
- 3.5s
- 4.0s
- 4.5s
- 5.0s
- 5.5s
- 6.0s
- 6.5s
- 7.0s
- 7.5s
- 8.0s
- 8.5s
- 9.0s
- 9.5s
- 10.0s
- 10.5s
- 11.0s
10/19/2023, 3:38:44 PM
- 13:25
- 13:30
- 13:35
- 13:40
- 13:45
- 13:50
- 13:55
- Page load
- Error
- session_start 0.019s
- Duration 0.019s
- Warning
- Error
| Timestamp | Page URL | Kind | Value | |
|---|---|---|---|---|
| https://acme-shop.example/ | Event | session_start | ||
| https://acme-shop.example/ | Measurement | page_load | ||
| https://acme-shop.example/products/1/detail | Error | TypeError: Cannot read properties of undefined | ||
| https://acme-shop.example/products/1/detail | Warning | Script error. | ||
| https://acme-shop.example/products/1/detail | Error | Error: Failed to fetch | ||
| https://acme-shop.example/product_detail | Measurement | page_load | ||
- 10
- 8
- 6
- 4
- 2
- 0
- 13:25
- 13:30
- 13:35
- 13:40
- 13:45
- 13:50
- 13:55
- Sessions
- Sessions with errors
Session explore
Tт| Session start | Session ID | Page ID | Errors | Browser name | Browser version | Platform | |
|---|---|---|---|---|---|---|---|
| 2023-10-19 09:29:51 | yEoB18maG9 | / | ⊕ | 2 | Chrome | 118.0.0.0 | Linux x86_64 |
| 2023-10-19 09:32:35 | C7ZT6fe1BR | product_detail | ⊕ | 4 | Chrome | 118.0.0.0 | Windows 10 |
| 2023-10-19 09:24:31 | TGDiZEpBcA | /products/1/detail | ⊕ | 6 | Chrome | 118.0.0.0 | Linux x86_64 |
| 2023-10-19 09:42:23 | JbkaGpC4tf | product_detail | ⊕ | 3 | Chrome | 118.0.0.0 | Mac OS 10.15.7 |
| 2023-10-19 09:24:11 | y8x7oUJcQ0 | /products/1/detail | ⊕ | 2 | Chrome | 118.0.0.0 | Linux x86_64 |
| 2023-10-19 09:41:30 | Tfvq8U6aCB | product_detail | ⊕ | 1 | Chrome | 118.0.0.0 | Ubuntu unknown |
| 2023-10-19 09:41:30 | Tfvq8U6aCB | /products/1/detail | ⊕ | 4 | Chrome | 118.0.0.0 | Mac OS 10.15.7 |
| 2023-10-19 09:41:30 | Tfvq8U6aCB | product_detail | ⊕ | 2 | Chrome | 118.0.0.0 | Linux x86_64 |
| 2023-10-19 09:41:30 | Tfvq8U6aCB | /products/1/detail | ⊕ | 6 | Chrome | 118.0.0.0 | Mac OS 10.15.7 |
| 2023-10-19 09:41:30 | Tfvq8U6aCB | product_detail | ⊕ | 12 | Chrome | 118.0.0.0 | Windows 10 |
| 2023-10-19 09:41:30 | Tfvq8U6aCB | product_detail | ⊕ | 2 | Chrome | 118.0.0.0 | Linux x86_64 |
| 2023-10-19 09:41:30 | Tfvq8U6aCB | /products/1/detail | ⊕ | 1 | Chrome | 118.0.0.0 | Linux x86_64 |
| 2023-10-19 09:34:07 | RC5h143Mxh | product_detail | ⊕ | 1 | Mobile Safari | 17.1 | iOS 16.6.1 |
- App name
- acme-monitoring
- Allowed domains
- *.acme-monitoring.com
- Session sampling
- 100%