Grafana Frontend Application Building a Real User Monitoring Solution
Designing an innovative RUM solution that simplifies complex data while providing actionable insights, challenging established vendors through user-centric design inspired by gaming UIs and modern IDEs.
Competing with Industry Giants
Market Reality
Real User Monitoring (RUM) solutions play a critical role in delivering exceptional digital experiences. However, many organizations face challenges in implementing and utilizing RUM effectively.
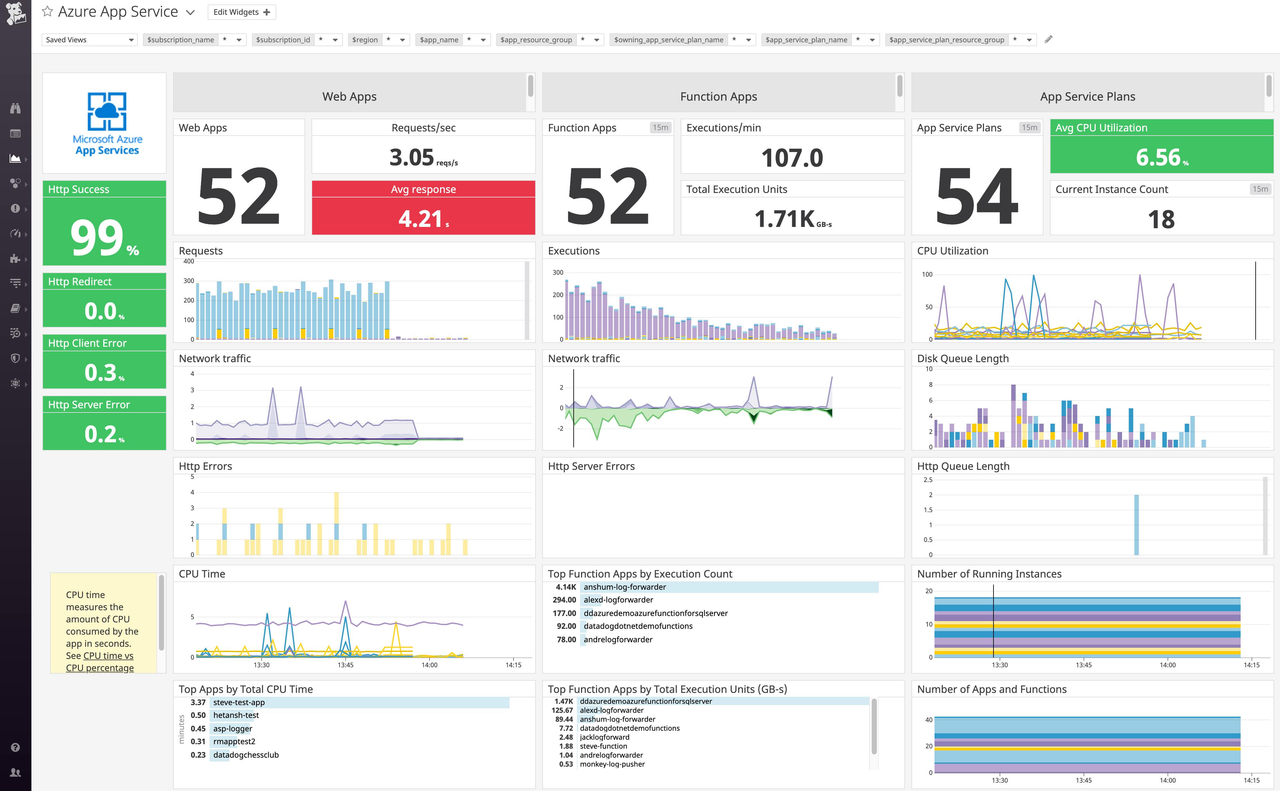
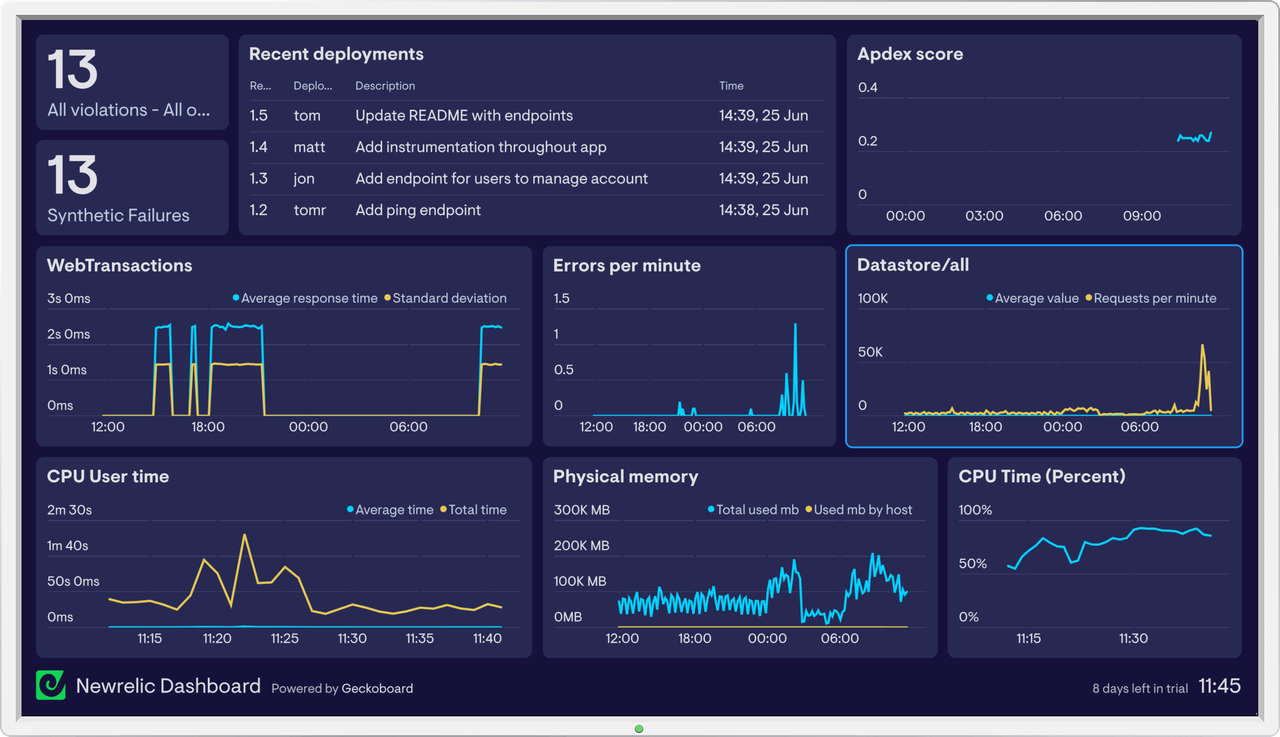
To stand out from established vendors like Datadog and New Relic, which have over 70% of Fortune 500 companies using their services, our tool had to simplify complex data while providing actionable insights.
- 75% reported experiencing integration challenges with existing infrastructure
- 40% struggled to understand insights generated by their RUM solution
- Complexity and lack of visibility cited as major obstacles
From Sketches to Systems
When designing our Real-time User Monitoring solution, information architecture was crucial to ensure users can effectively navigate and make sense of the data being presented. This involved thinking about the overall structure and organization of the UI, including categorization, grouping, and labeling of data elements.
Early Exploration
I drew inspiration from user-friendly interfaces in video games, where intuitive designs enable users to quickly grasp complex information. Programming IDEs like Visual Studio Code and IntelliJ have set a high standard for simplicity and ease of use.
Our target audience—developers, product managers, and IT teams—spend significant time monitoring and troubleshooting but often struggle to make sense of vast amounts of data.
Clarity
Our tool should clearly communicate complex data information to users
Consistency
Interface should be consistent in layout and structure to reduce confusion
Usability
Easy to use, even for users who are not experts in data analysis
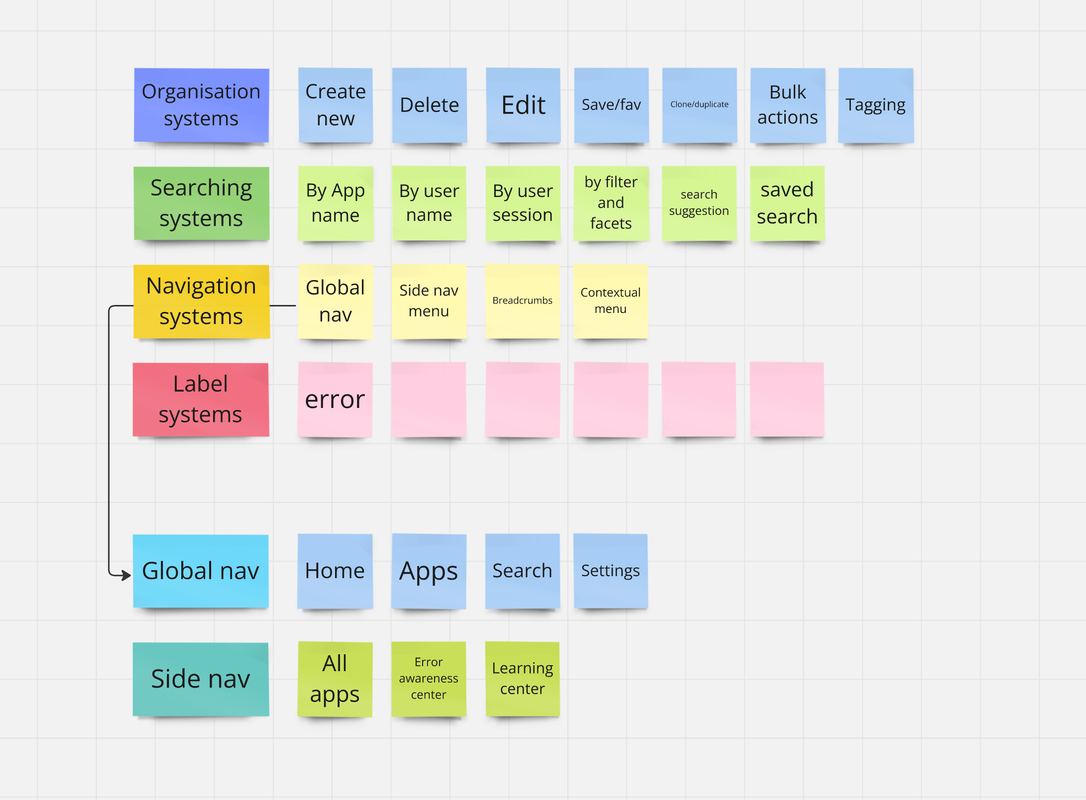
Collaborative design exploration and information architecture mapping
Ship, Learn, Iterate
After completing the initial design phase, we adopted a rapid iteration cycle, enabling us to quickly ship features, gather feedback from users, and iterate based on that input.
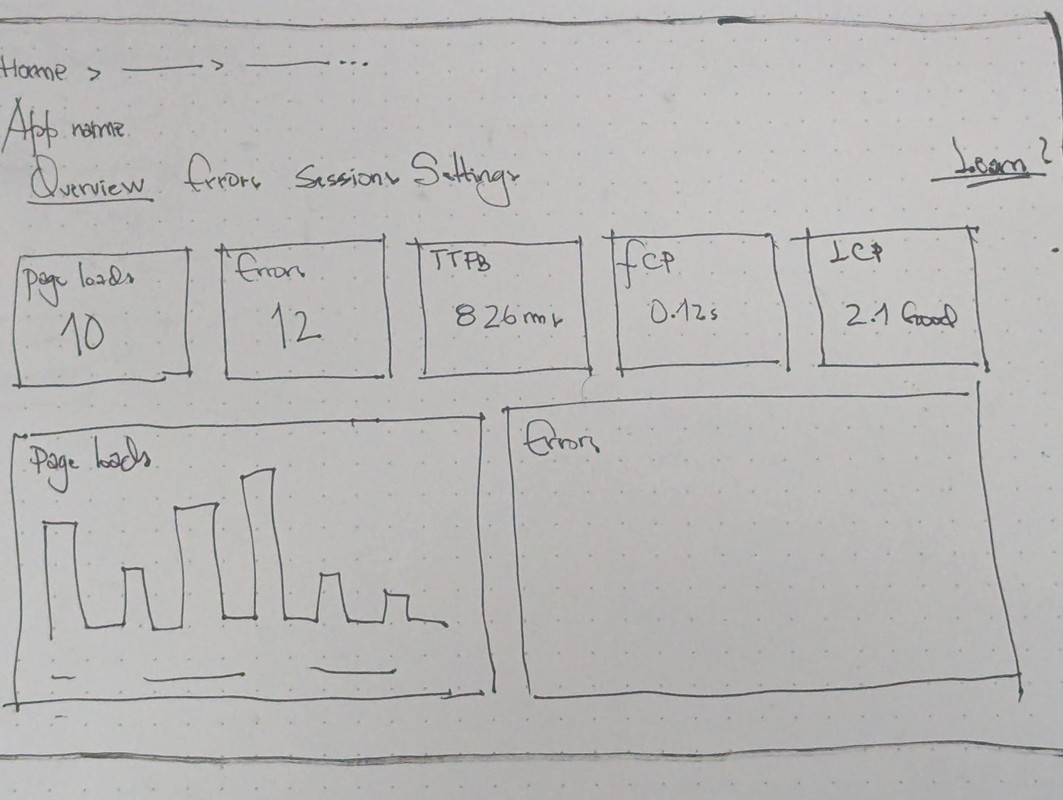
Initial Concepts
Early experimentation allowed me to test assumptions, learn from failures, and converge on the best fit—all while keeping deadlines and technical feasibility in mind.
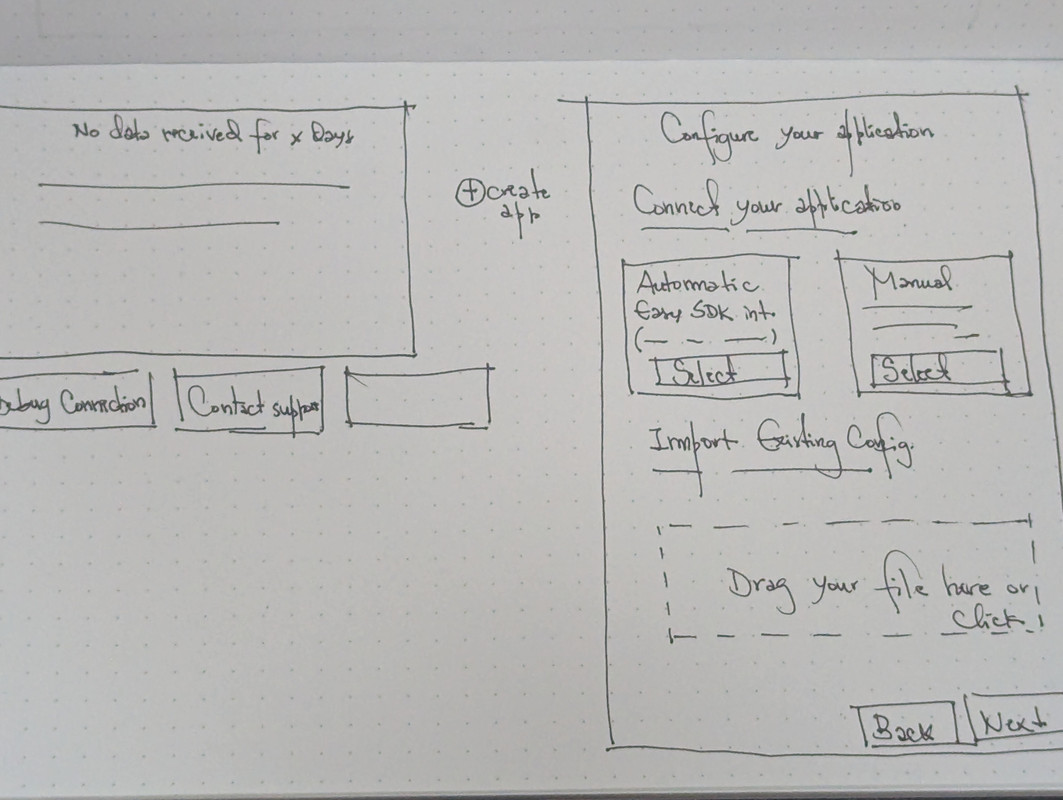
Onboarding Exploration
Testing with users in small iterations, sharing and asking for feedback at every stage to ensure we're on the right track.
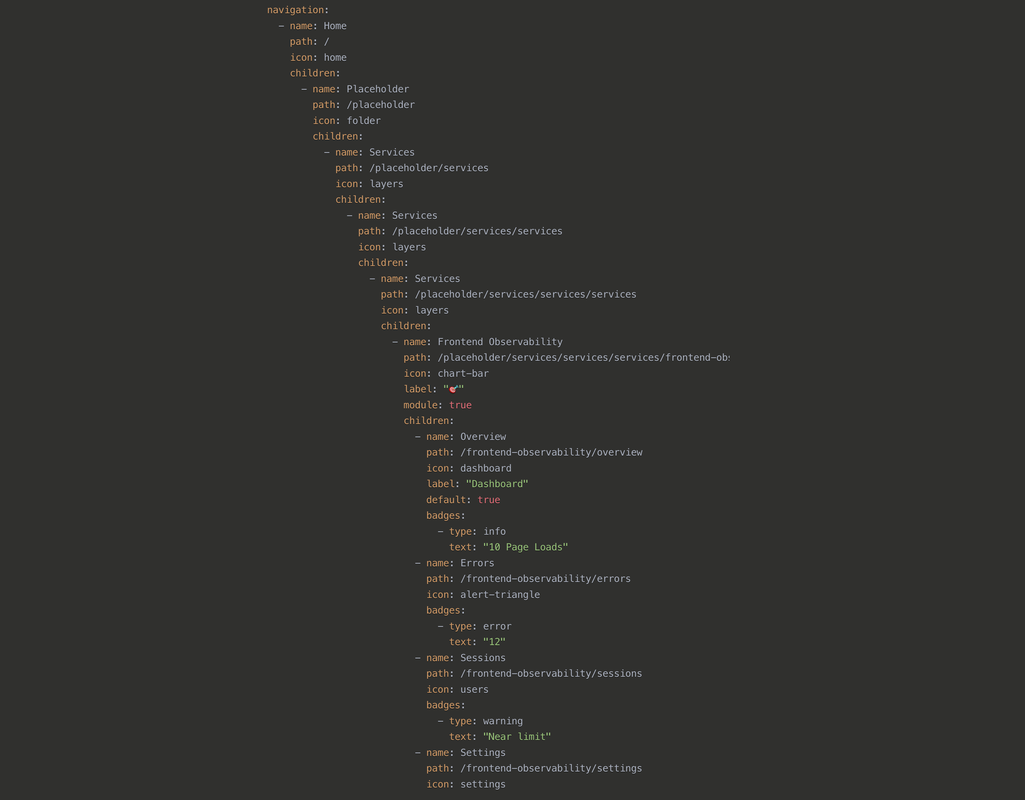
Component Refinement
Continually reusing and refining existing components and patterns, identifying opportunities to innovate and strengthen our design system.
"I don't hesitate to share my imperfect ideas and failures with the team. It's at this stage where I aim to foster a culture of shared understanding and inclusive design, but more importantly, it's these moments that help me build trust—by embracing vulnerability and openness."
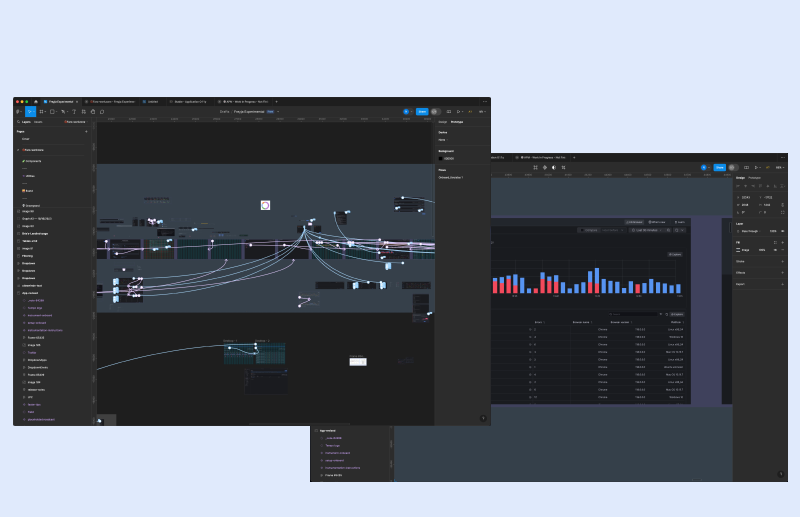
High-Fidelity Prototyping
Design System Contributions
Contributing back to Grafana Labs design system while building new features and components.
Unhappy Paths
Anticipating all possible scenarios: What if a user encounters an issue? What happens when something goes wrong? Designing solutions that cover both happy and unexpected paths.
Stakeholder Alignment
Sharing early with stakeholders to ensure alignment on feasibility and business goals, reducing the risk of costly rework or scope creep.
Technical Integration
In my design process, I balanced my time between crafting designs and diving into the technical nuances of OpenTelemetry (OTel) and our Faro web SDK.
This approach significantly bolstered trust among product managers and engineers, accelerating the project far more effectively than static mockups or low-fidelity prototypes ever could.
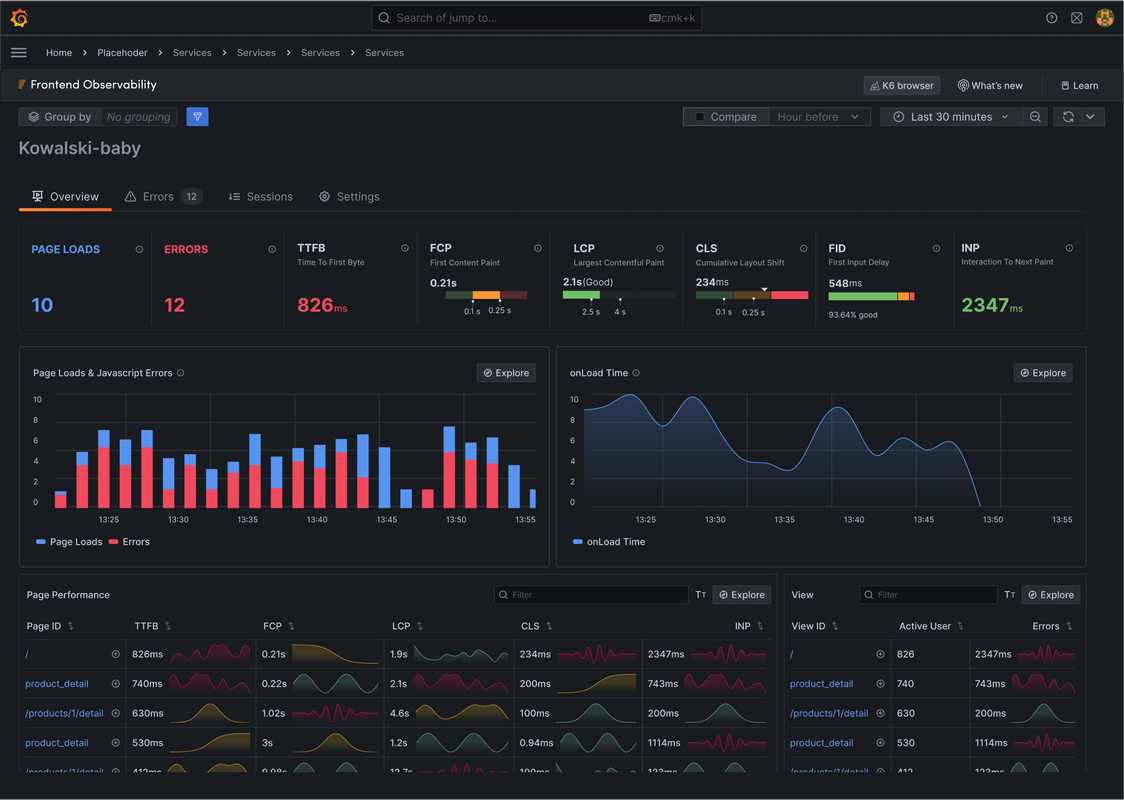
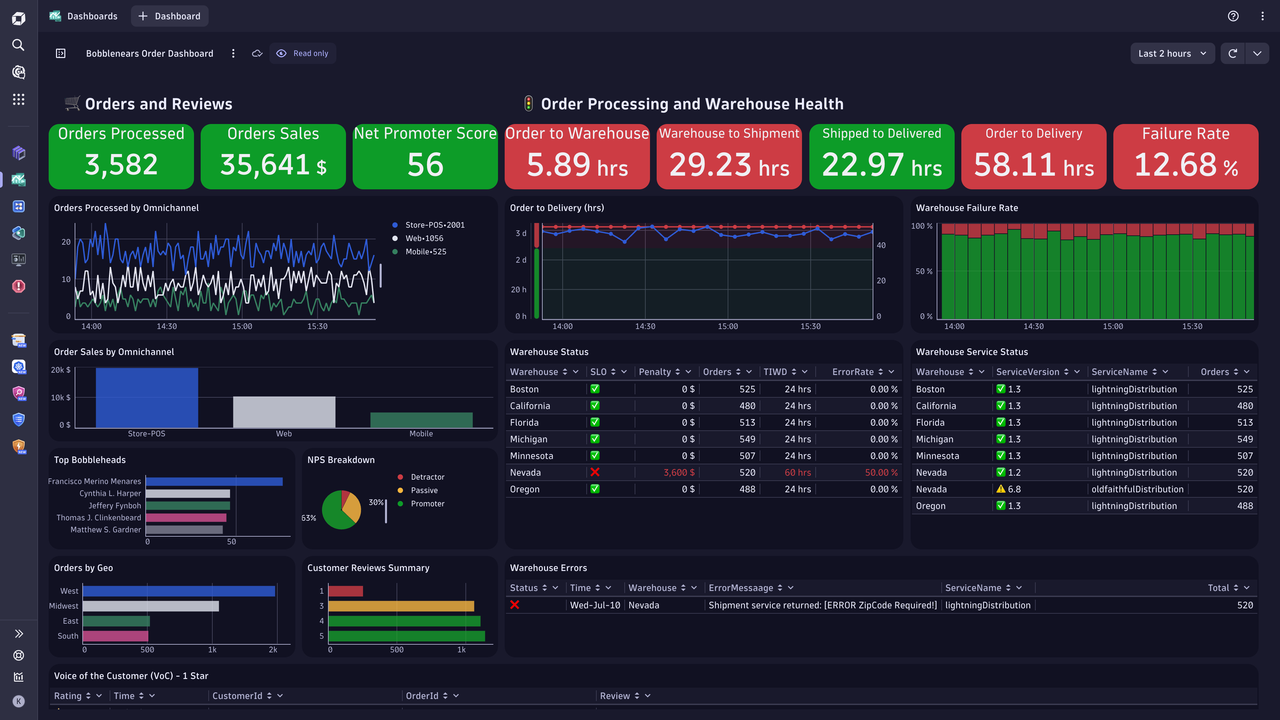
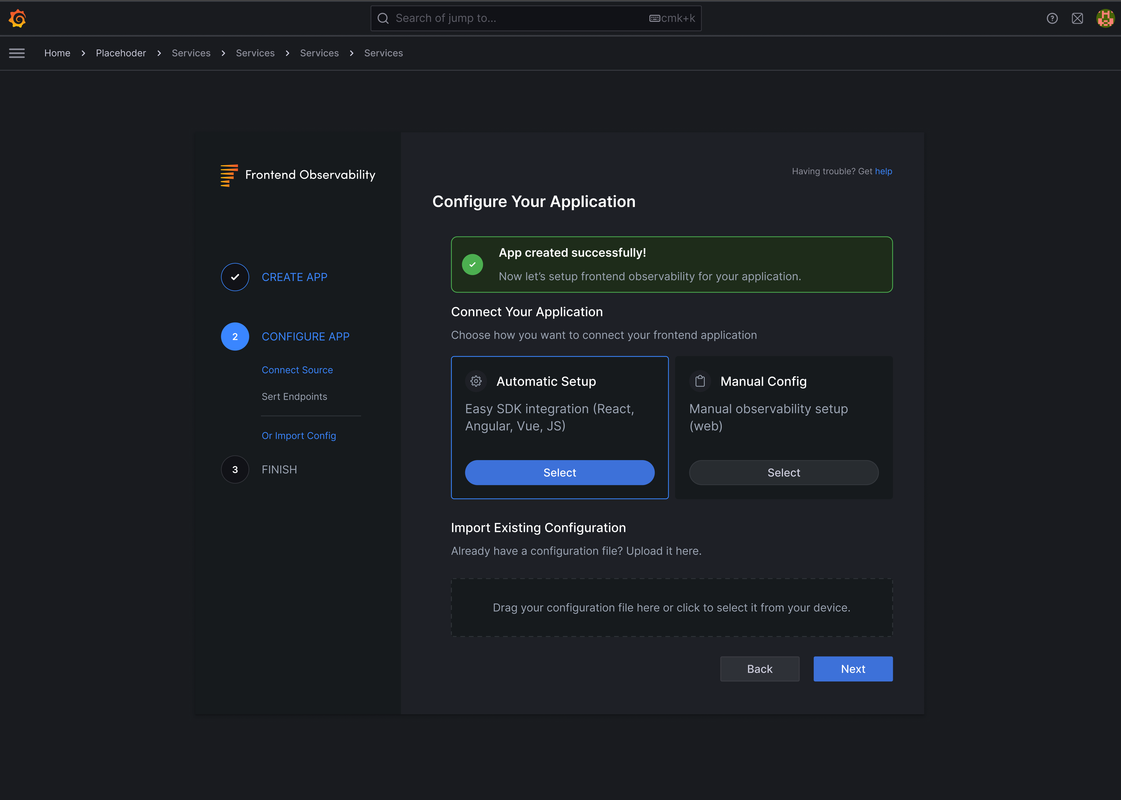
Final implementation showcasing the complete RUM solution interface
The Complete Experience
Accelerating Through High-Fidelity
Project Success
By leveraging high-fidelity prototyping, we clearly revealed certainties and uncertainties for product managers, engineers, and users alike, accelerating the identification of solid solution paths worth pursuing.
This flexible foundation enabled more frequent testing and iteration, ultimately refining and perfecting our designs faster and more efficiently.
- Rapid iteration cycles reduced development time by 40%
- High-fidelity prototypes built trust with engineering teams
- Design system contributions adopted company-wide
- User-centric approach validated through continuous testing
Looking back, I'm confident that high-fidelity prototyping was a critical factor in our project's success. By embracing this approach, we created a more user-centric design process that yielded tangible results and exceeded expectations.