I was the original designer of Grafana’s application observability, from a hackathon project to GA. The goal: make APM work for people who don’t think in queries.
I was the original designer of Grafana’s application observability, from a hackathon project to GA. The goal: make APM work for people who don’t think in queries.
Observability for people who don’t think in queries.
grafana.com/cloud
The findingLess technical users left after a week.
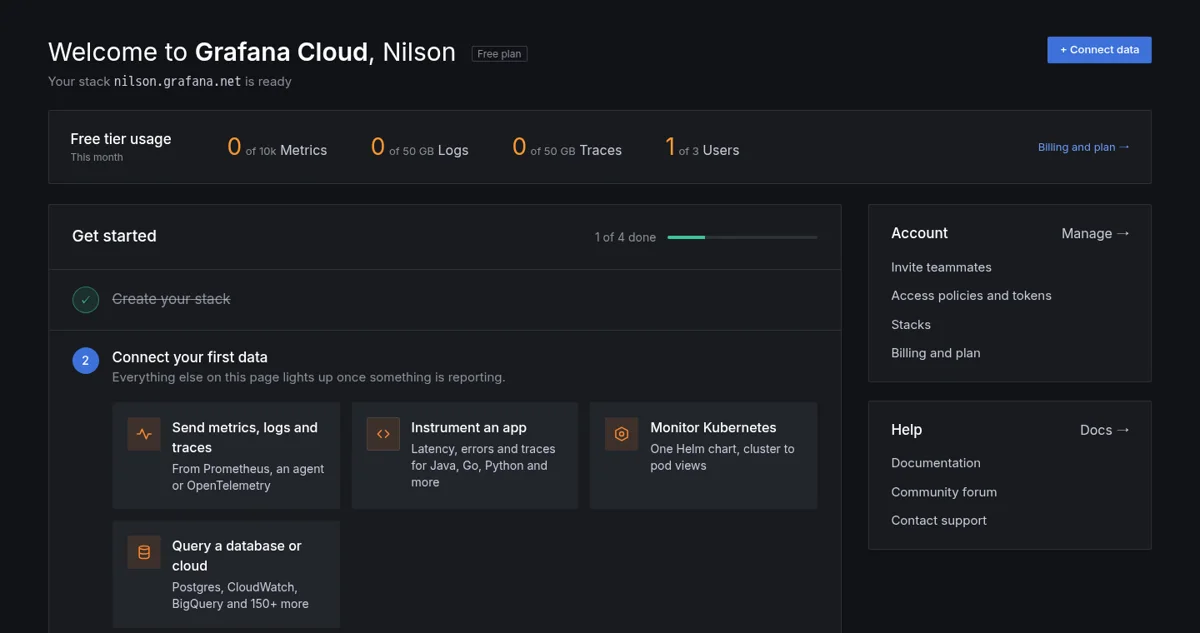
I interviewed 8 current users. They couldn’t find what mattered for their own monitoring goals, and the jargon pushed newer users away.
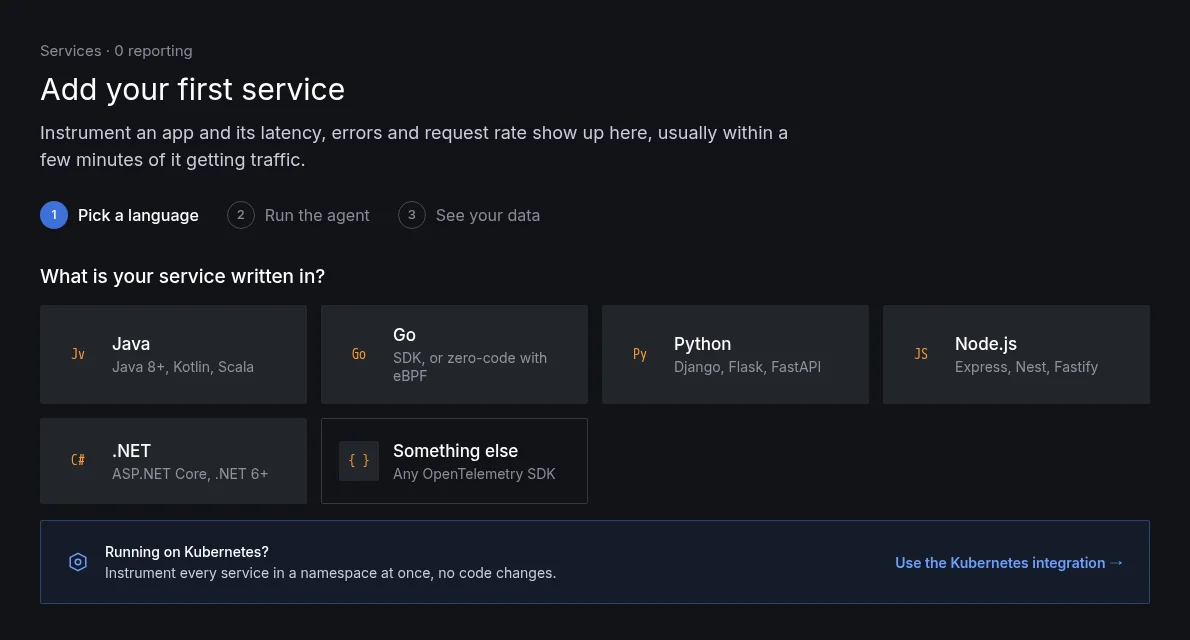
The decisionThe empty state is the first step of setup.
No blank screen: “Add your first service” asks one question, what your service is written in, and shows where it will appear.
About setup · Chapter 02
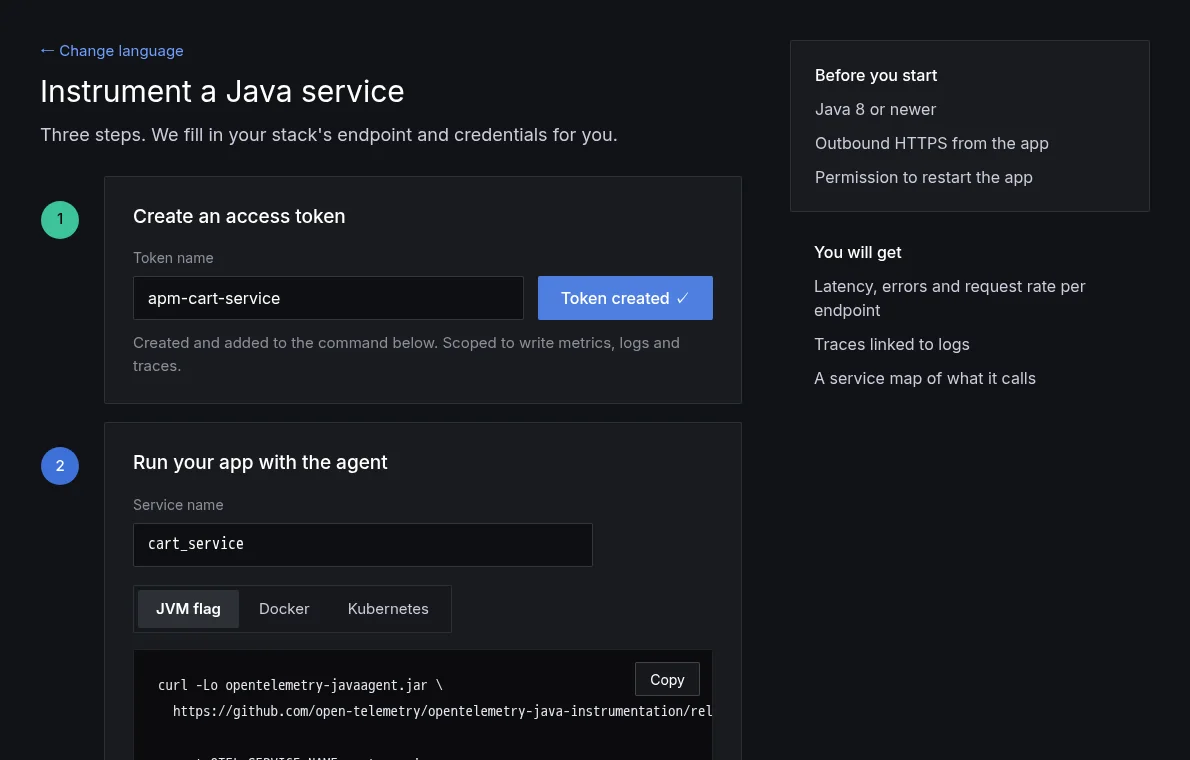
Three steps from nothing to your first span.
grafana.com/cloud
The decisionWe fill in the endpoint and the token.
Creating the token and naming the service writes the real command for you, for a JVM flag, Docker or Kubernetes.
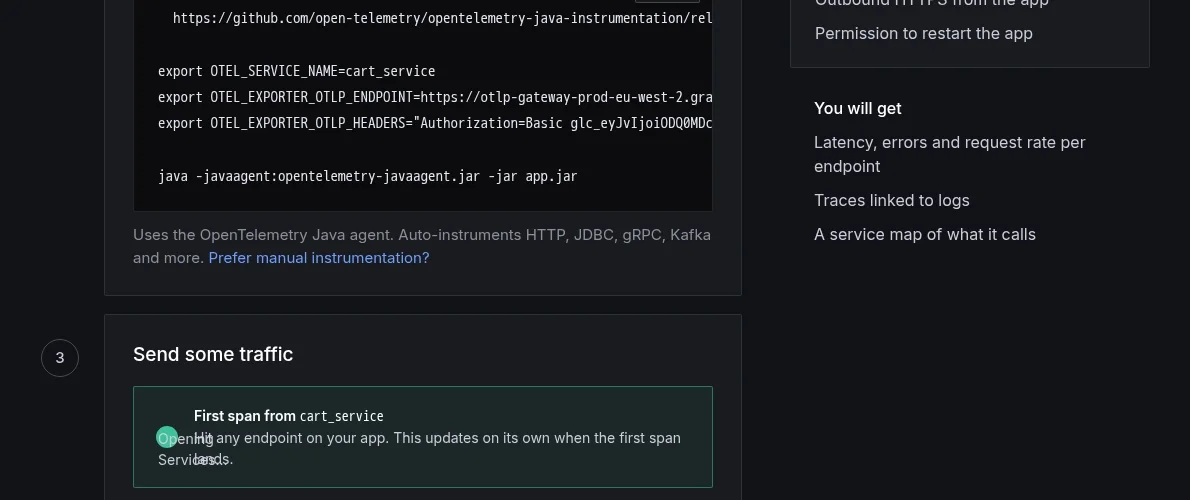
The detailThe page waits with you.
Step three listens for the first span and moves on by itself, with help ready if nothing arrives.
About the service · Chapter 03
Everything about a service, on one page.
grafana.com/cloud
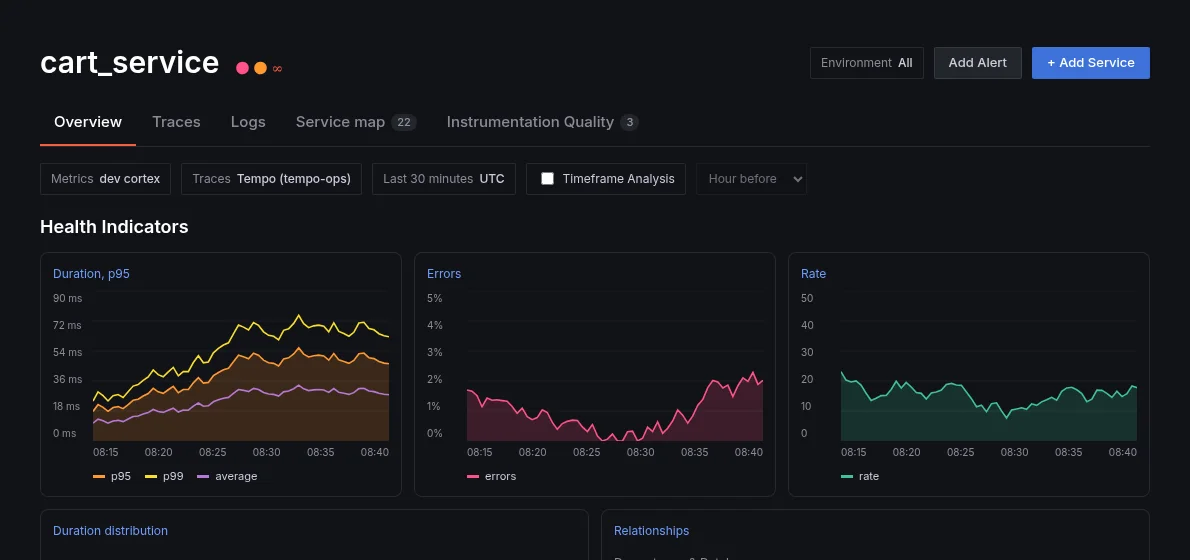
The decisionHealth first: duration, errors, rate.
The three numbers people ask about first, then who the service calls and its slowest operations.
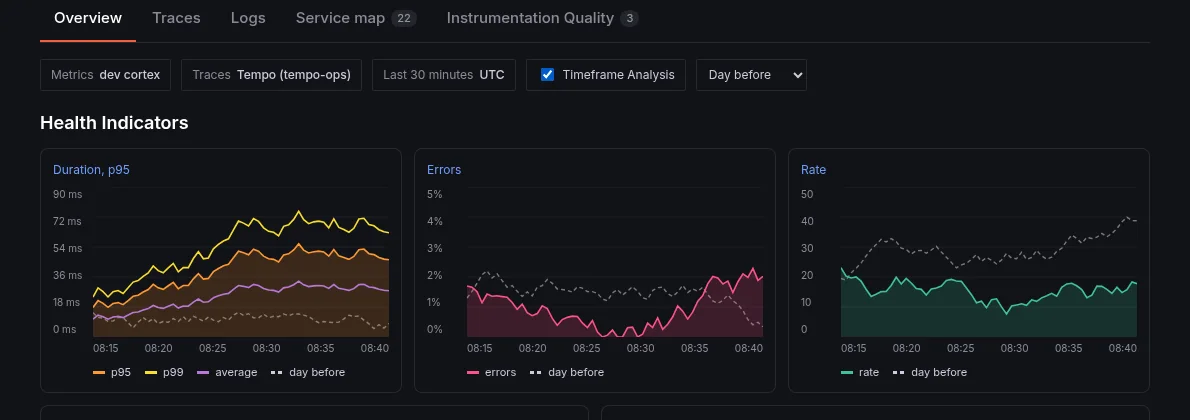
The detailCompare with an earlier period.
Timeframe Analysis lays the hour, day or week before over every chart, so “is this normal?” is answered on the page.
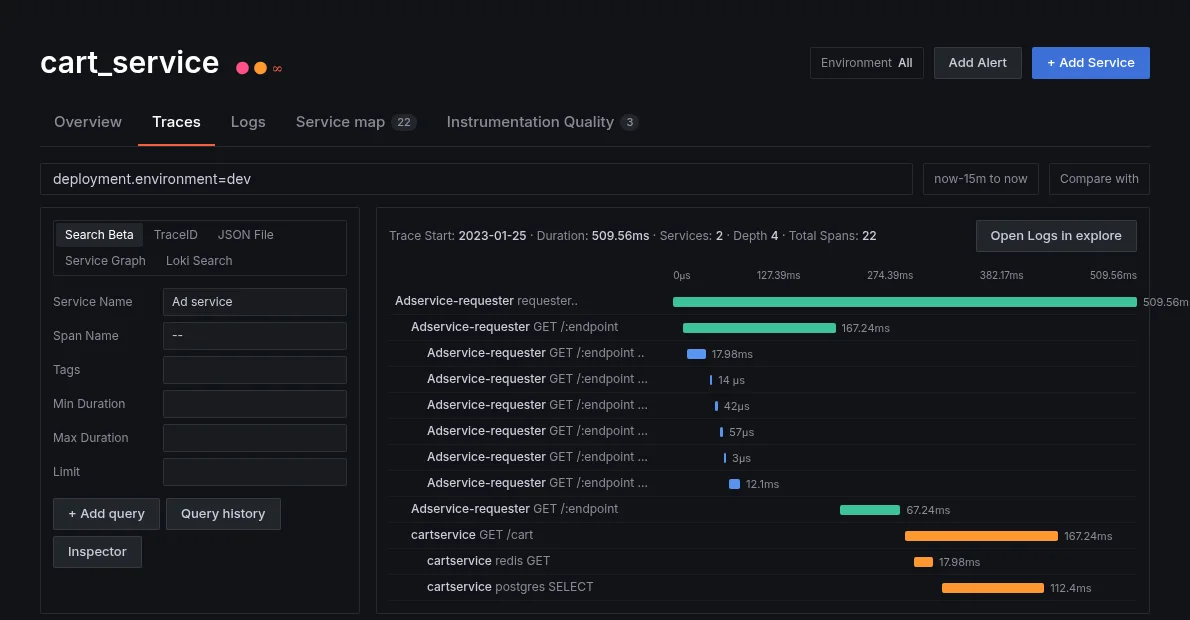
The decisionTraces, logs and the map, one tab away.
Visual exploration first, queries when you want them: the service map and traces live next to the overview.
What shipped
APM that scales from novice to expert.
Visual discovery and progressive disclosure, so the same product works for an SRE and for someone opening it for the first time.
OnboardingSetup in plain steps, matched to the user’s goal and skill level
NavigationOrganised around monitoring goals, not technical concepts
ExplorationVisual discovery for users who don’t think in queries
Design systemIllustrations and patterns contributed back
How I got thereResearch, principles, the design system
The approach
The critical outcome from our team workshops was the idea to visually answer: “What is Grafana Cloud?”
SimplicityPlain steps with minimal jargon, adapted to the user’s skill level.
DiscoverabilityInformation architecture reorganised around monitoring goals.
Visual firstInteractive, visual exploration instead of query-first screens.
Scale with expertiseNovices get guidance; experts keep the depth Grafana is known for.
What users told us
I interviewed 8 current users. The common pain point: navigating the apps to find information tailored to their own monitoring goals. Less technical users preferred visual, interactive ways of exploring, and struggled with jargon and navigation patterns that were second nature to DevOps professionals.
The shipped product
Application Observability: simplified navigation and visual discoveryDesign system contributions, including custom illustrations